With 95 standard reports and a wide variety of custom reports that you have the capability of creating in SmarterStats, it’s hard to tell which are the most important to keep an eye on. Most people really only need to keep track of 3 or 4 reports including:
- Monthly Visitors
- Visit Length
- Referring Sites
- Top Pages
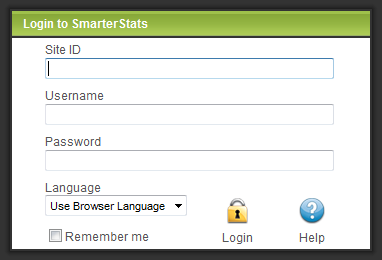
Your first step is to login to SmarterStats (if you need the URL, let me know).
If this is your first time logging in, you will be asked to setup a couple of preferences for your dashboard.
On the dashboard, you will find a Views and Visits chart, Bandwidth Usage Graph, Top Pages list, Top Referrers list, Search Engines chart and Top Search Phrases list. These items will display typically an overview of your last 7 days unless you selected otherwise in the preferences.

Now let’s navigate to the Monthly Visitors report.
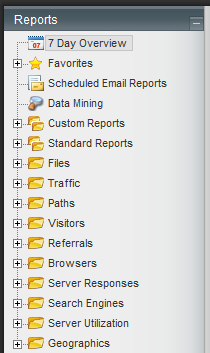
On the left side of the page, click on the (+) next to Visitors, click on Monthly Visitors in the menu that appears below it. It will most likely show you the past 7 days again here, so in order to change that click on the “Show Date Ranges” link at the top right below the calendar. Click on the calendar icon to the right of the start field, select the day, do the same for the end date and then click the Get Report button. If you need to go back to another month, there are icons at the top for that. You will see colums for Visits, Unique Visitors, New Visitors and Return Visitors.
- Visits: represents the total number of times people have visited your website.
- Unique Visitors: represents any number of visits from the same computer.
- New Visitors: represents a visit by a computer that has not yet been to the website in the time period of the report.
- Return Visitors: counted when a computer that has already been to the website before returns. In order to see this data, you must select a date range of at least 2 months.
Now let’s check out the Visit Length report.
Over on the left side in the Visitors menu your going to click on Monthly Visit Length to view this report. Your data show will be for your latest selected date range, so that may or may not need to be adjusted. You will see two columns on the report; Visits and Visit Length. I like to pull at least the last 90 – 180 days so I can see the trend on this report.
- Visit Length: the number of seconds that a visit lasts on average for the date range.
Moving on to the Referring Sites report.
Click on the (+) next to Referrals, click on Referring Sites in the menu that appears below it. Once again you will need to check the date range at the top and adjust as necessary. You will see columns for Rank, Host and Visits. This particular report includes search engines and individual websites. If you want to see the referals from just the search engines you would click on the (+) next to Search Engines on the left and click the Engine Breakdown link.
- Host: the website from which visitors to your website came from. A value of “no referrer” represents a visitor typing your website address directly into their browser, using a bookmark or following a link from an email message.
The final report you will want to check out is the Top Pages report.
Click on the (+) next to Files, click on Pages in the menu that appears below it. As with the others you will need to check the date range and adjust if needed. You will see columns for Page, Page Views, Visits and Bandwidth. For most of you the first item will simply have “/”, which is simply your websites homepage.
- Page: a website generally contains a collection of different pages that are accessible and viewable via a web browser. SmarterStats considers the following extensions to be pages: .ASP, .ASPX, .CFC, .CFM, .CFMX, .CFML, .CGI, .HTM, .HTML, .IDA, .IDC, .JHTM, .JHTML, .JSP, .JWS, .MHT, .MHTML, .MV, .PHP, .PHP3, .PHTM, .PHTML, .PL, .SHTM, .SHTML, .STM, .WML, .XDL, .XHTML and .XML.
- Page Views: a successful request for a file on your website that is considered to be a page. Views generated as a result of an error are kept separate.
- Bandwidth: the total number of kilobytes that were sent to people visiting your website.
For all of these reports, if you want to see more data, change the chart type used, apply filters, etc., you can use the drop-down menus on the right side below the calendar. Remember to click the Get Report button if you change any of these items to generate new data based on your criteria here.
You should receive an email on the 1st of each month with a rundown of your website statistics from the previous month. If you are not getting that email, please let me know ASAP so I can get that resolved for you.
Cindy Spencer 🙂

